The thermodynamics of a strongly interacting Fermi gas can give an insight into the state of the cloud. In recent years, much effort has been put by many labs around the world into measuring the equation of state, pressure, energy, entropy and compressibility of the gas at different temperatures and interaction strengths. In many of this measurements, one can overcome the fact that the density of a trapped gas is not homogeneous by measuring local quantities (e.g. measuring the pressure at some position in the cloud). In the JILA degenerate Fermi gas lab we used a different technique based on optical pumping with hollow-core beams, to measure an important thermodynamic quantity called “Tan’s contact”.
To understand what the contact is, let’s imaging a Fermi gas at a magnetic field such that the scattering length is very small and the gas can be said to be weakly interacting (the magnetic field sets the scattering length through the Fano-Feshbach resonance). Here, we assume that the scattering length is negative, such that there is no two-body bound state. Now, let’s ramp the magnetic field very slowly towards the Feshbach resonance. Clearly, the magnitude of the scattering length increases, and the interaction energy of the cloud increase as well. A question which we may want to ask is what is the change in the energy of the cloud as we adiabatically change the interaction strength. The quantity that measures the change in the energy with an adiabatic change of the inverse of the scattering length is called Tan’s contact (up to some constants). It is named after Shina Tan, who showed that this quantity appears in many other seemingly unrelated relations, which makes it a very useful quantity.
The actual value of the contact depends on the temperature and interaction strength. Close to the temperature where the Fermi gas becomes superfluid, the predictions by different many-body theories for the value of the contact differ quite a bit. This is true for a homogeneous gas, but for a trapped gas these differences are washed out. Therefore, it is most useful to measure the contact of a homogeneous gas in order to be able to compare and distinguish between theoretical models.
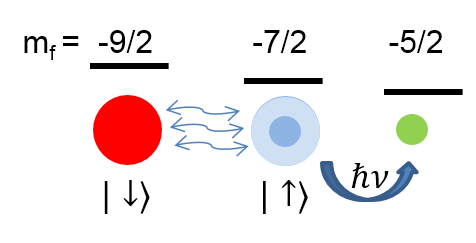
In order to measure the contact, we used the fact that it appears in a relation that describes the tail of the rf lineshape. To understand what do we mean by that, let’s first describe the experiment we perform. We start with our Fermi gas at the two interacting states (red and blue in the figure below), and then turn on an rf field in an antenna positioned close to the atoms. The antenna creates radiation, very similar to radio transmission, which can be described by photons with a specific energy that relates to the frequency of the oscillating field. If the energy is matching the energy difference between one of the interacting states and some other third state, which is initially not populated (green in the figure below). The photons can cause atoms to flip their spin and be transferred to the third state. For a given number of incident photons, we can measure the number of atoms that flipped their spin. If we now repeat this measurement with many different photon frequencies, we get the probability that a photon at a given frequency will transfer an atom to the third spin state. This function is called rf lineshape, and it encapsulates much of the physics of the interacting states. In terms of interpreting the experimental results, it makes life much easier if the third spin state is weakly interacting with the two other spin states. This is the case with 40K, which makes it a very good atom for spectroscopic measurements.

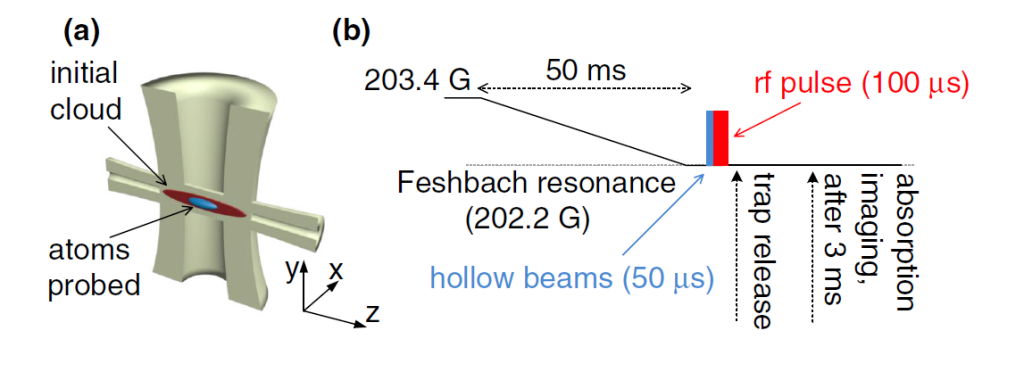
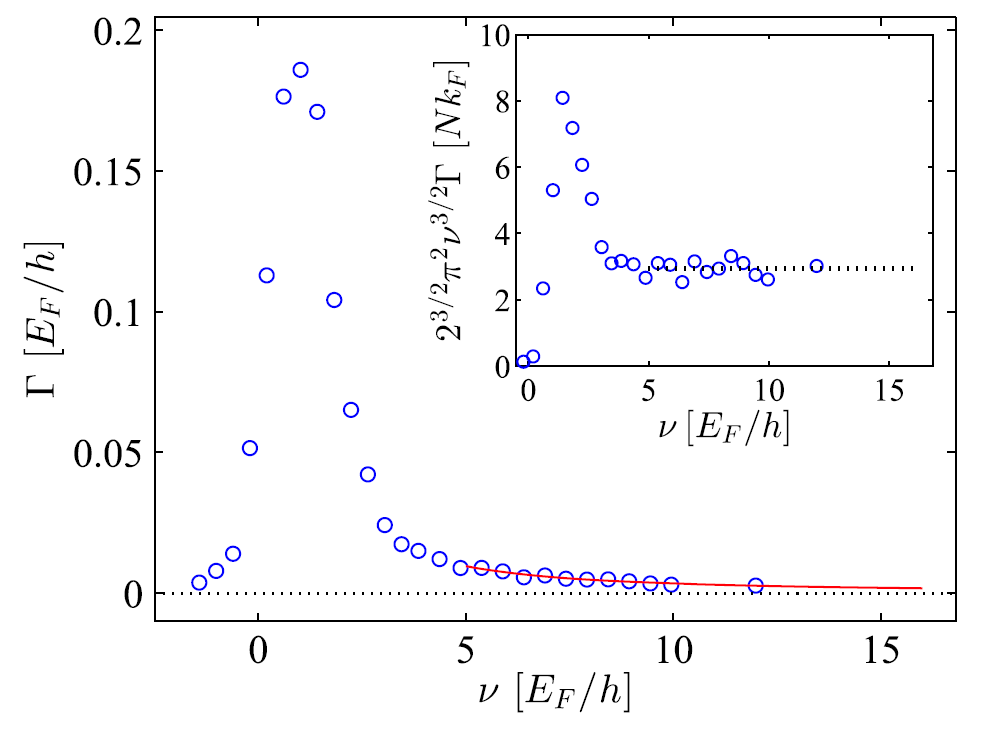
In a Fermi gas with contact interactions, the high frequency tail of the rf-lineshape scales as ν-3/2, where ν is the frequency the photon. The pre-factor of this scaling is proportional to the contact, which means that by measuring the rf-lineshape and looking on the scaling of its tail, one can extract the contact. Since we are interested in the contact of a homogeneous gas, we would like to selectively probe only the central part of the cloud for probing, before inducing the rf transition. This is done with using the hollow-core technique, which is explained here. In short, two orthogonal laser beams with a doughnut-shape spatial mode are used to optically pump atoms in the outskirts of the cloud to a state which is invisible in the probing (see panel a in the following figure). The experimental sequence is the following: we ramp the magnetic field from the field at which we prepare our cloud to the field at which we are going to measure the contact. As we want to measure the contact at unitarity (at the Feshbach resonance), this field corresponds to 202.2 Gauss. We then switch on the hollow-beams, and follow with the rf pulse. We then release the trap and measure the number of atoms in the weakly-interacting state (-5/2) after 3ms of expansion.

An example of such a line-shape can be seen in the following figure. In the inset, the line-shape is multiplied by ν3/2, and the existence of the plateau marks the presence of the contact, and enables us to extract it.

Next, we need to determine the temperature of the cloud. We so it by measuring the release energy of the gas, and using the measured equation of state of a unitary cloud, we extract the temperature. The release energy is measured by turning off the trap and letting the cloud expand in the resonance field. That way, the interaction energy is converted and added to the kinetic energy of the cloud. A measurement of the position distribution of the cloud after a long expansion amounts to measuring its momentum distribution and the total release energy.
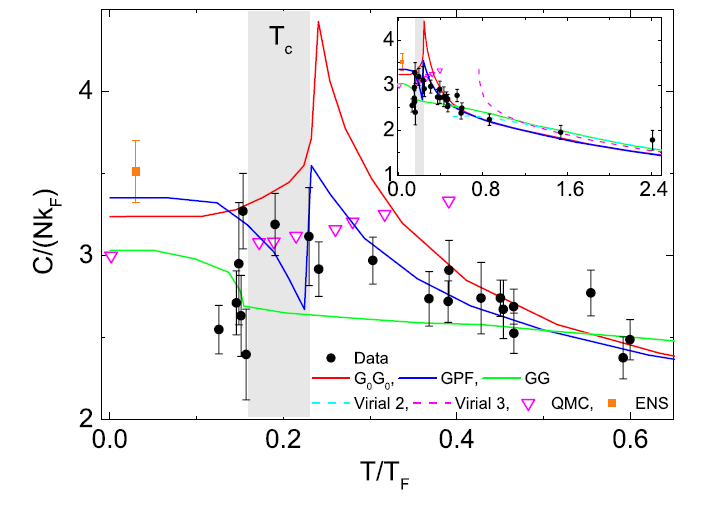
The experiment is therefore the following; we control the temperature of the cloud by using different cooling trajectory. For every set of thermodynamic condition, we measure the release energy, from which we can extract the temperature. We then measure the rf line-shape of the central 30% of the original cloud, from which we extract the contact of the quasi-homogeneous part of the unitary Fermi cloud in the center. The result, namely the homogeneous contact as function of temperature is shown below (black circles), together with several theoretical predictions (colors lines).

If you want to read more about this experiment and understand the significance of these results, refer to the publication here or here.
